Montana University System
Regents' July 2002 Management Report


Enrollment


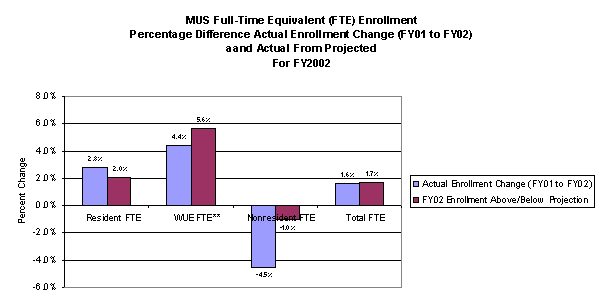
Resident, Non-Resident and WUE Enrollment

The blue bar shows the change in FTE enrollment between FY01 and FY02 by category.  


The red bar shows the difference in actual enrollment from projected for FY02.

Chart

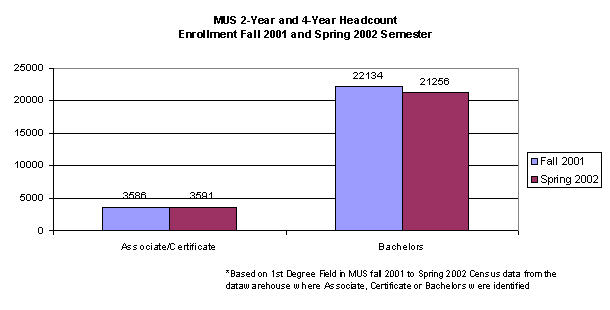
2 Yr & 4 Yr Enrollment
MUS System

Spring 2002 Enrollment in 2 year degree programs increased slightly over Fall 2001. Enrollment in Bachelors degree programs declined.

Chart

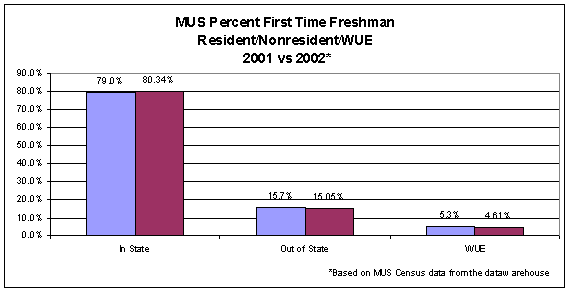
First-Time Freshmen Only


Resident, Non-Resident and WUE Enrollment

Overall enrollment of MUS First-Time, Resident Freshmen increased

from AY 2001 to AY 2002 by 1.3%.

Chart


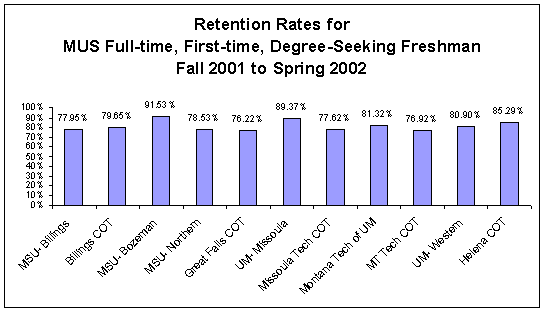
Freshmen Retention
Fall to Spring

The Average Retention Rate for MUS First-time, Degree Seeking Freshmen was 81.39% from Fall 2001 to Spring 2002


Chart

Preparation


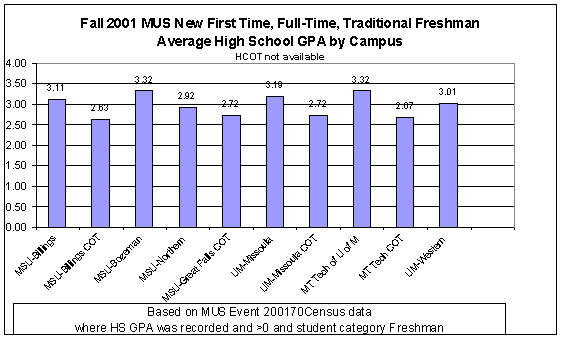
Average High School GPA by Enrollment Categories

For Fall 2001, the overall average HS GPA was  3.15 for those enrolled on MUS  4-year campuses. The overall average HS GPA was 2.69 for those enrolled in the Colleges of Technology.

Chart


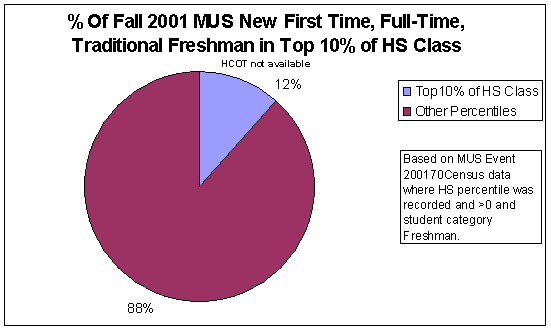
Percent of Freshmen in Top 10% of High School Class

Approximately 12% of MUS Freshmen were in the Top 10% of their HS Graduating Classes.

Chart

Class Size


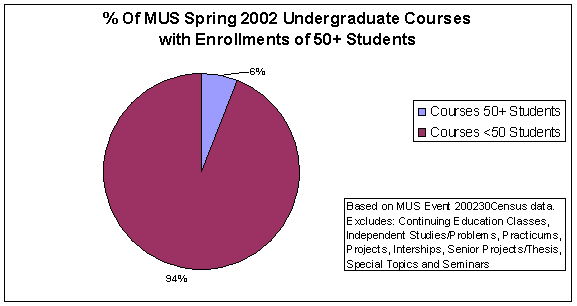
Percent of Classes 50+ students

6% of all Spring 2002 MUS classes have 50+ students enrolled

Chart


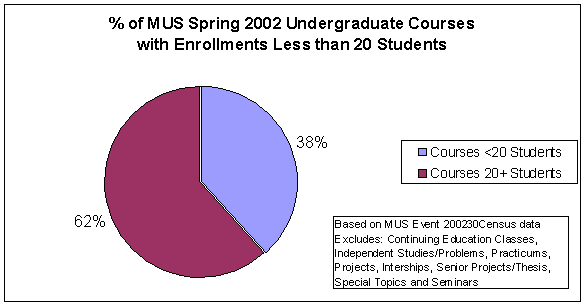
Percent of Classes <20 students

38% of all Spring 2002  MUS classes have <20 students enrolled

Chart

Revenues & Expenses


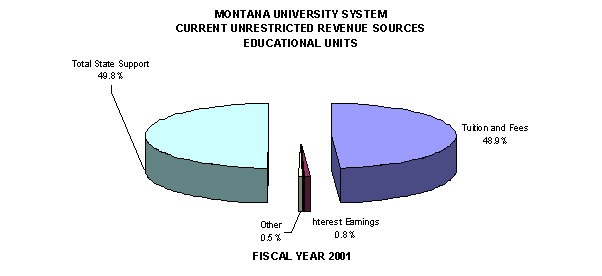
Total Revenue by Source
FY 2001

Chart


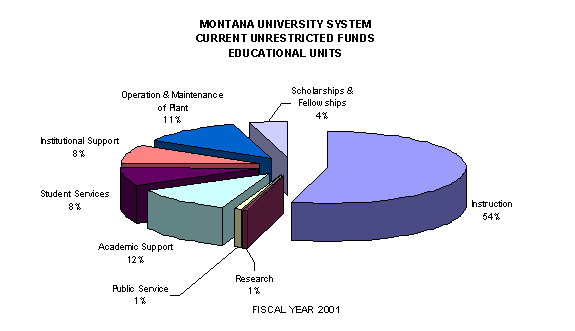
Current Unrestricted Expenditures FY 2001


Chart